Tornado Risk Analysis (Texas, USA)
County-level ESG Risk Assessment using GIS & Spatial Analysis
Project Overview
Objective
Assess county-level tornado risk in Texas using an integrated ESG framework, moving beyond hazard-only metrics to incorporate social vulnerability and governance capacity.
Motivation
Driven by a long-standing interest in extreme weather and its uneven impacts across communities.
Aims to understand why regions with similar tornado exposure can experience vastly different outcomes due to socioeconomic and institutional factors.
Data & Methods
Data Sources:
NOAA historical tornado records (Historical)
U.S. Census county-level socioeconomic indicators (ACS 5-year)
FEMA disaster assistance data (Historical)
Analytical Approach:
Data cleaning, normalization, and ESG score construction using Python (Pandas, NumPy) and Excel
Exploratory analysis and visualization in R (ggplot2)
GIS-based spatial analysis (choropleth mapping, hotspot analysis, quadrant analysis)
Key Insight
Counties with elevated tornado exposure often exhibit weaker social conditions and governance capacity, indicating structural vulnerability that cannot be explained by hazard frequency alone.
Results & Findings
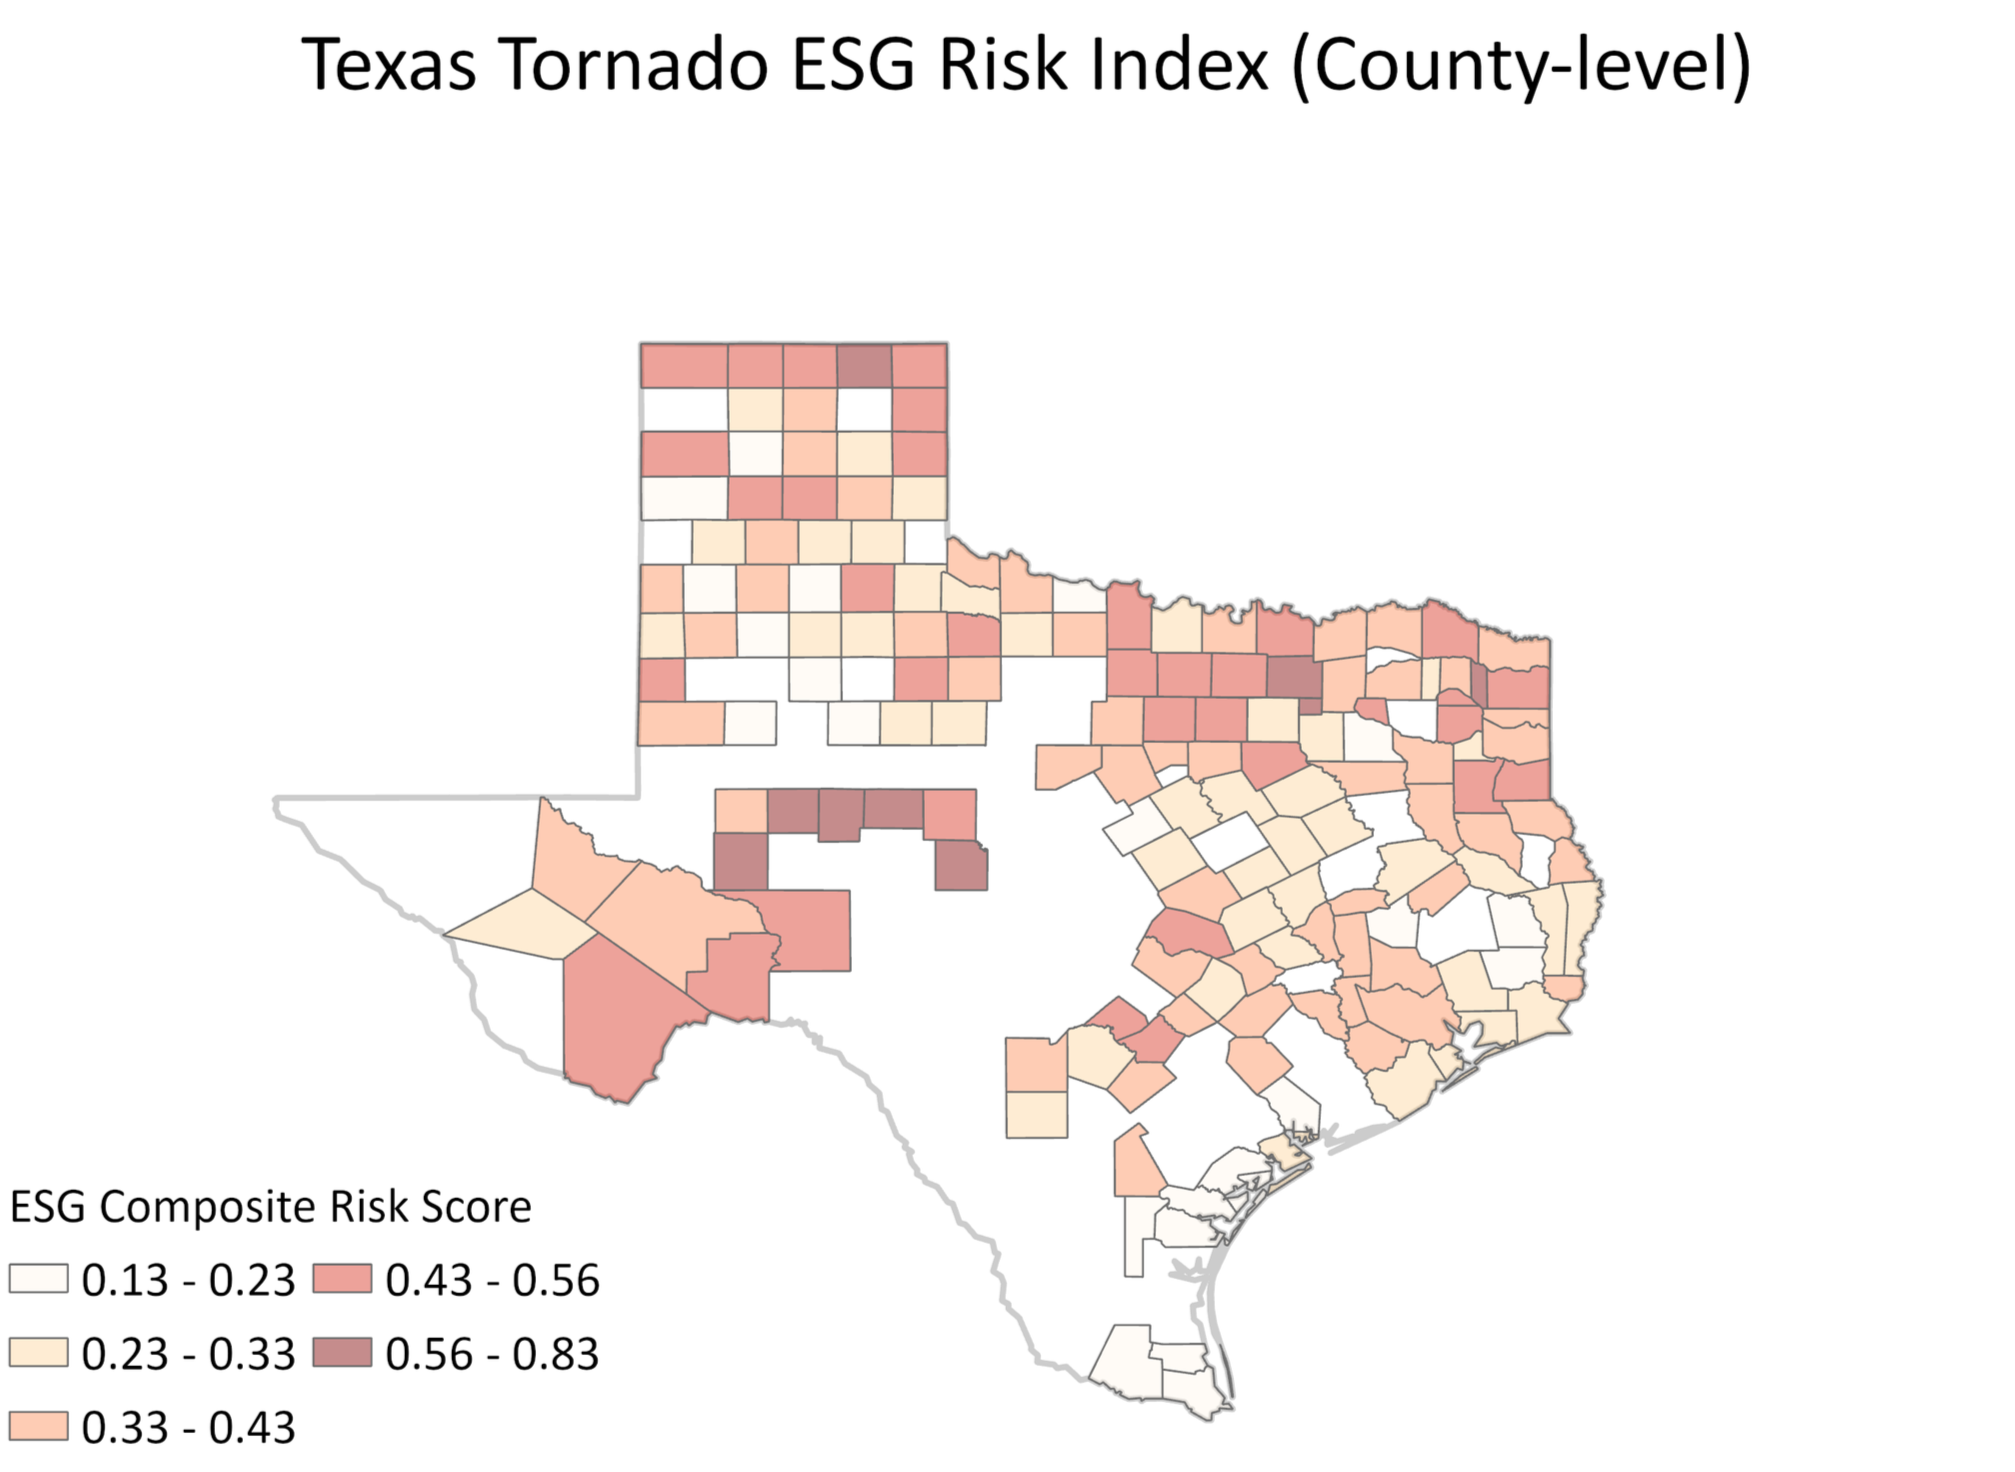
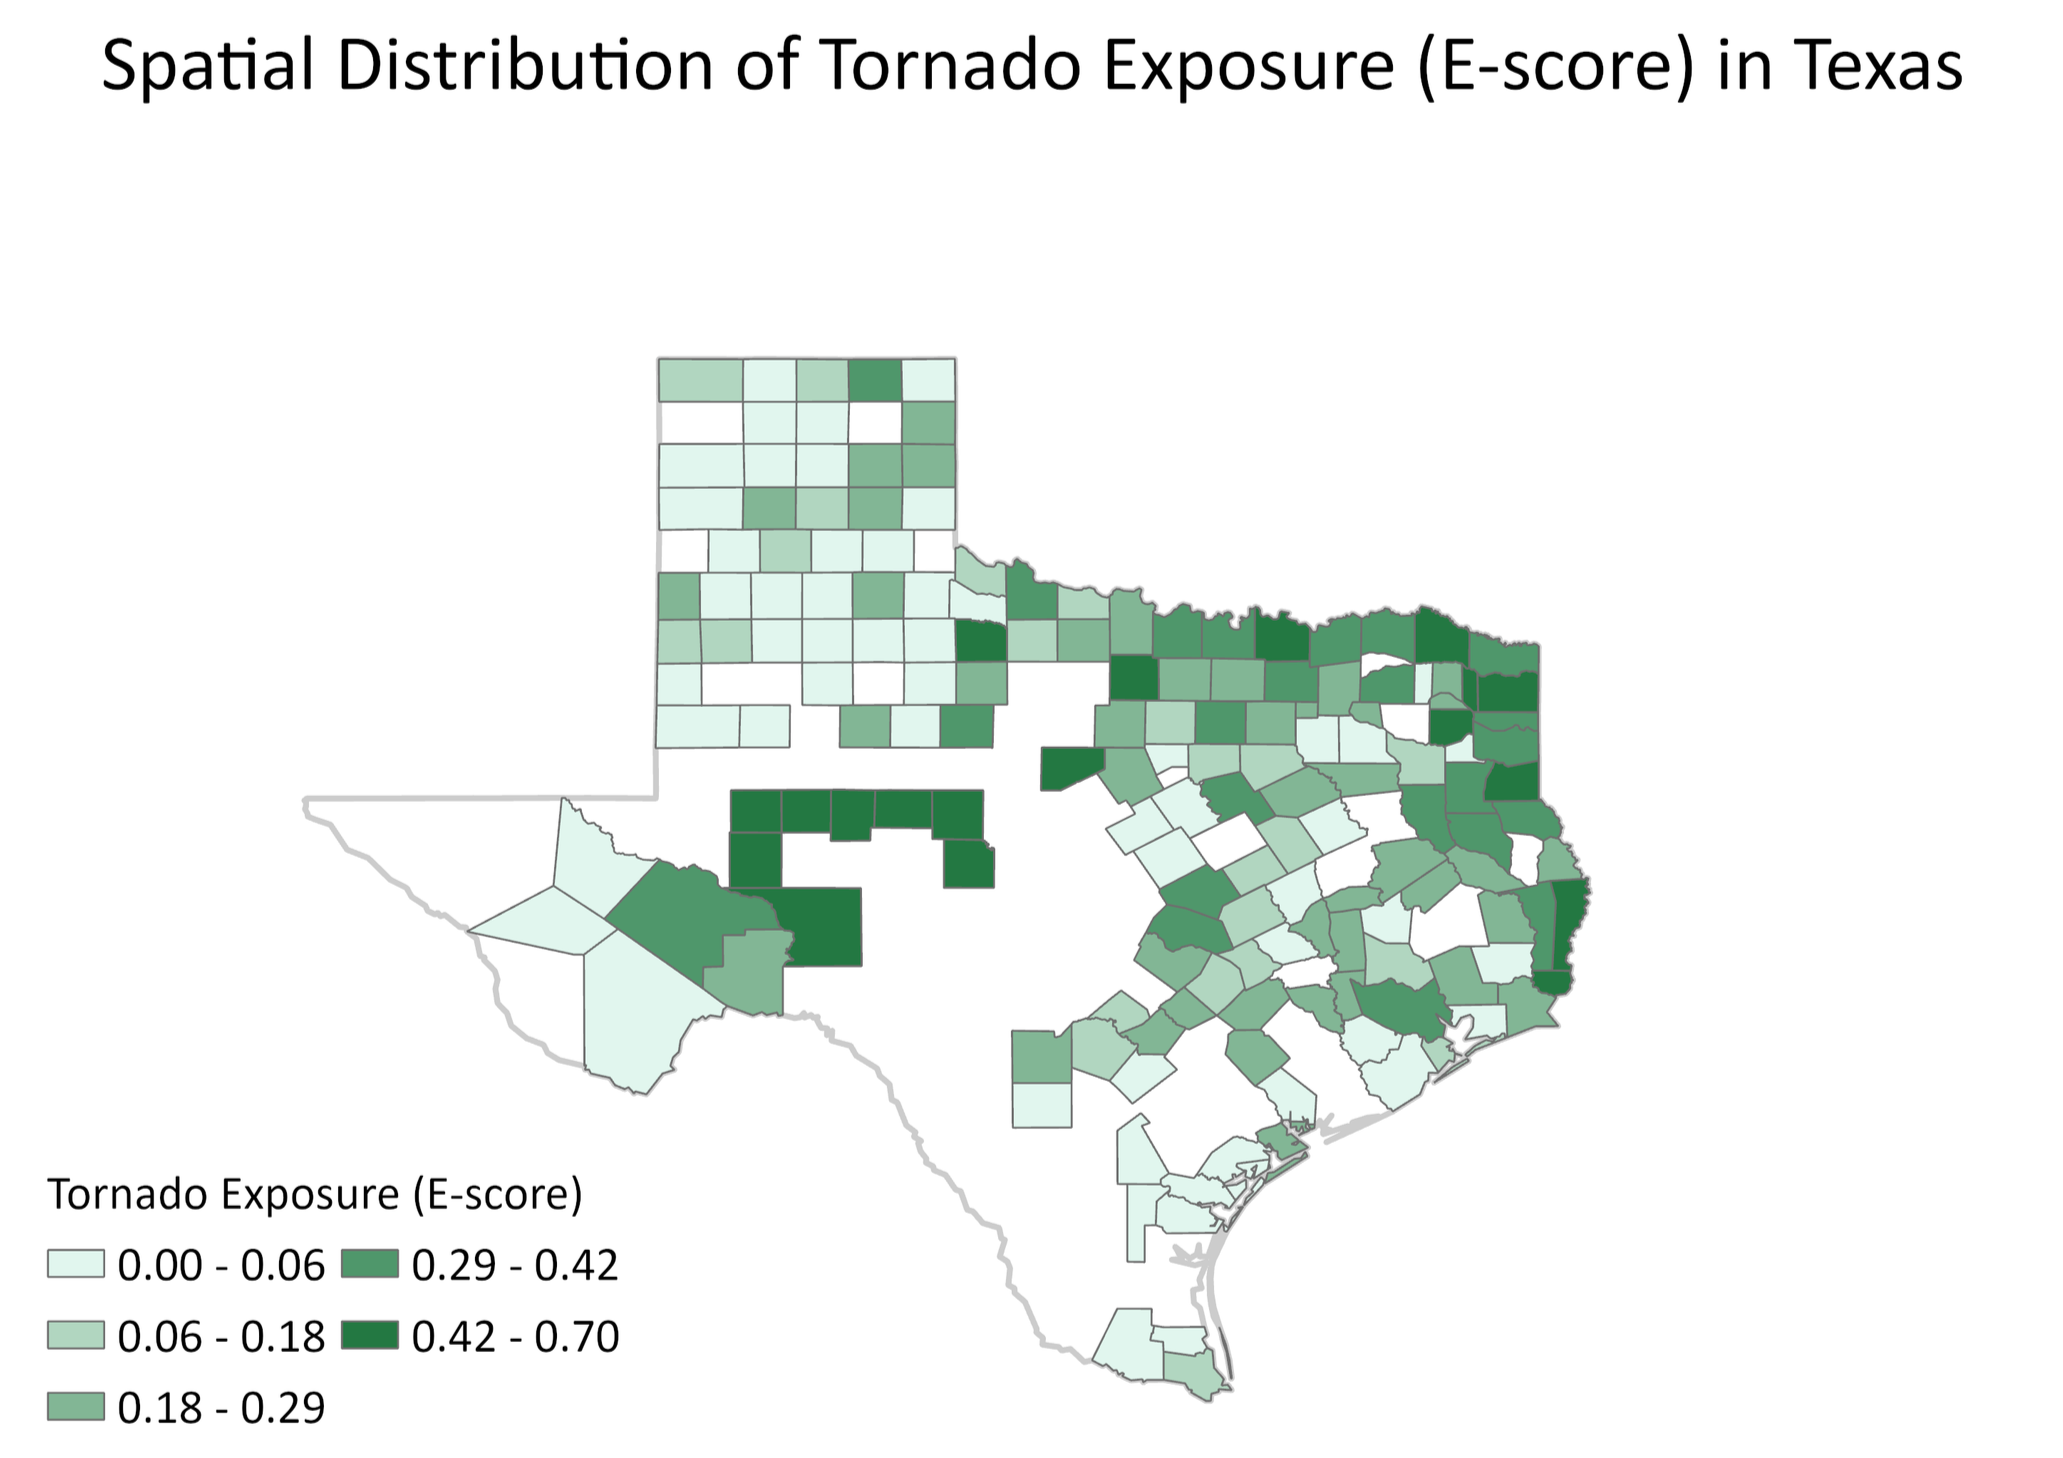
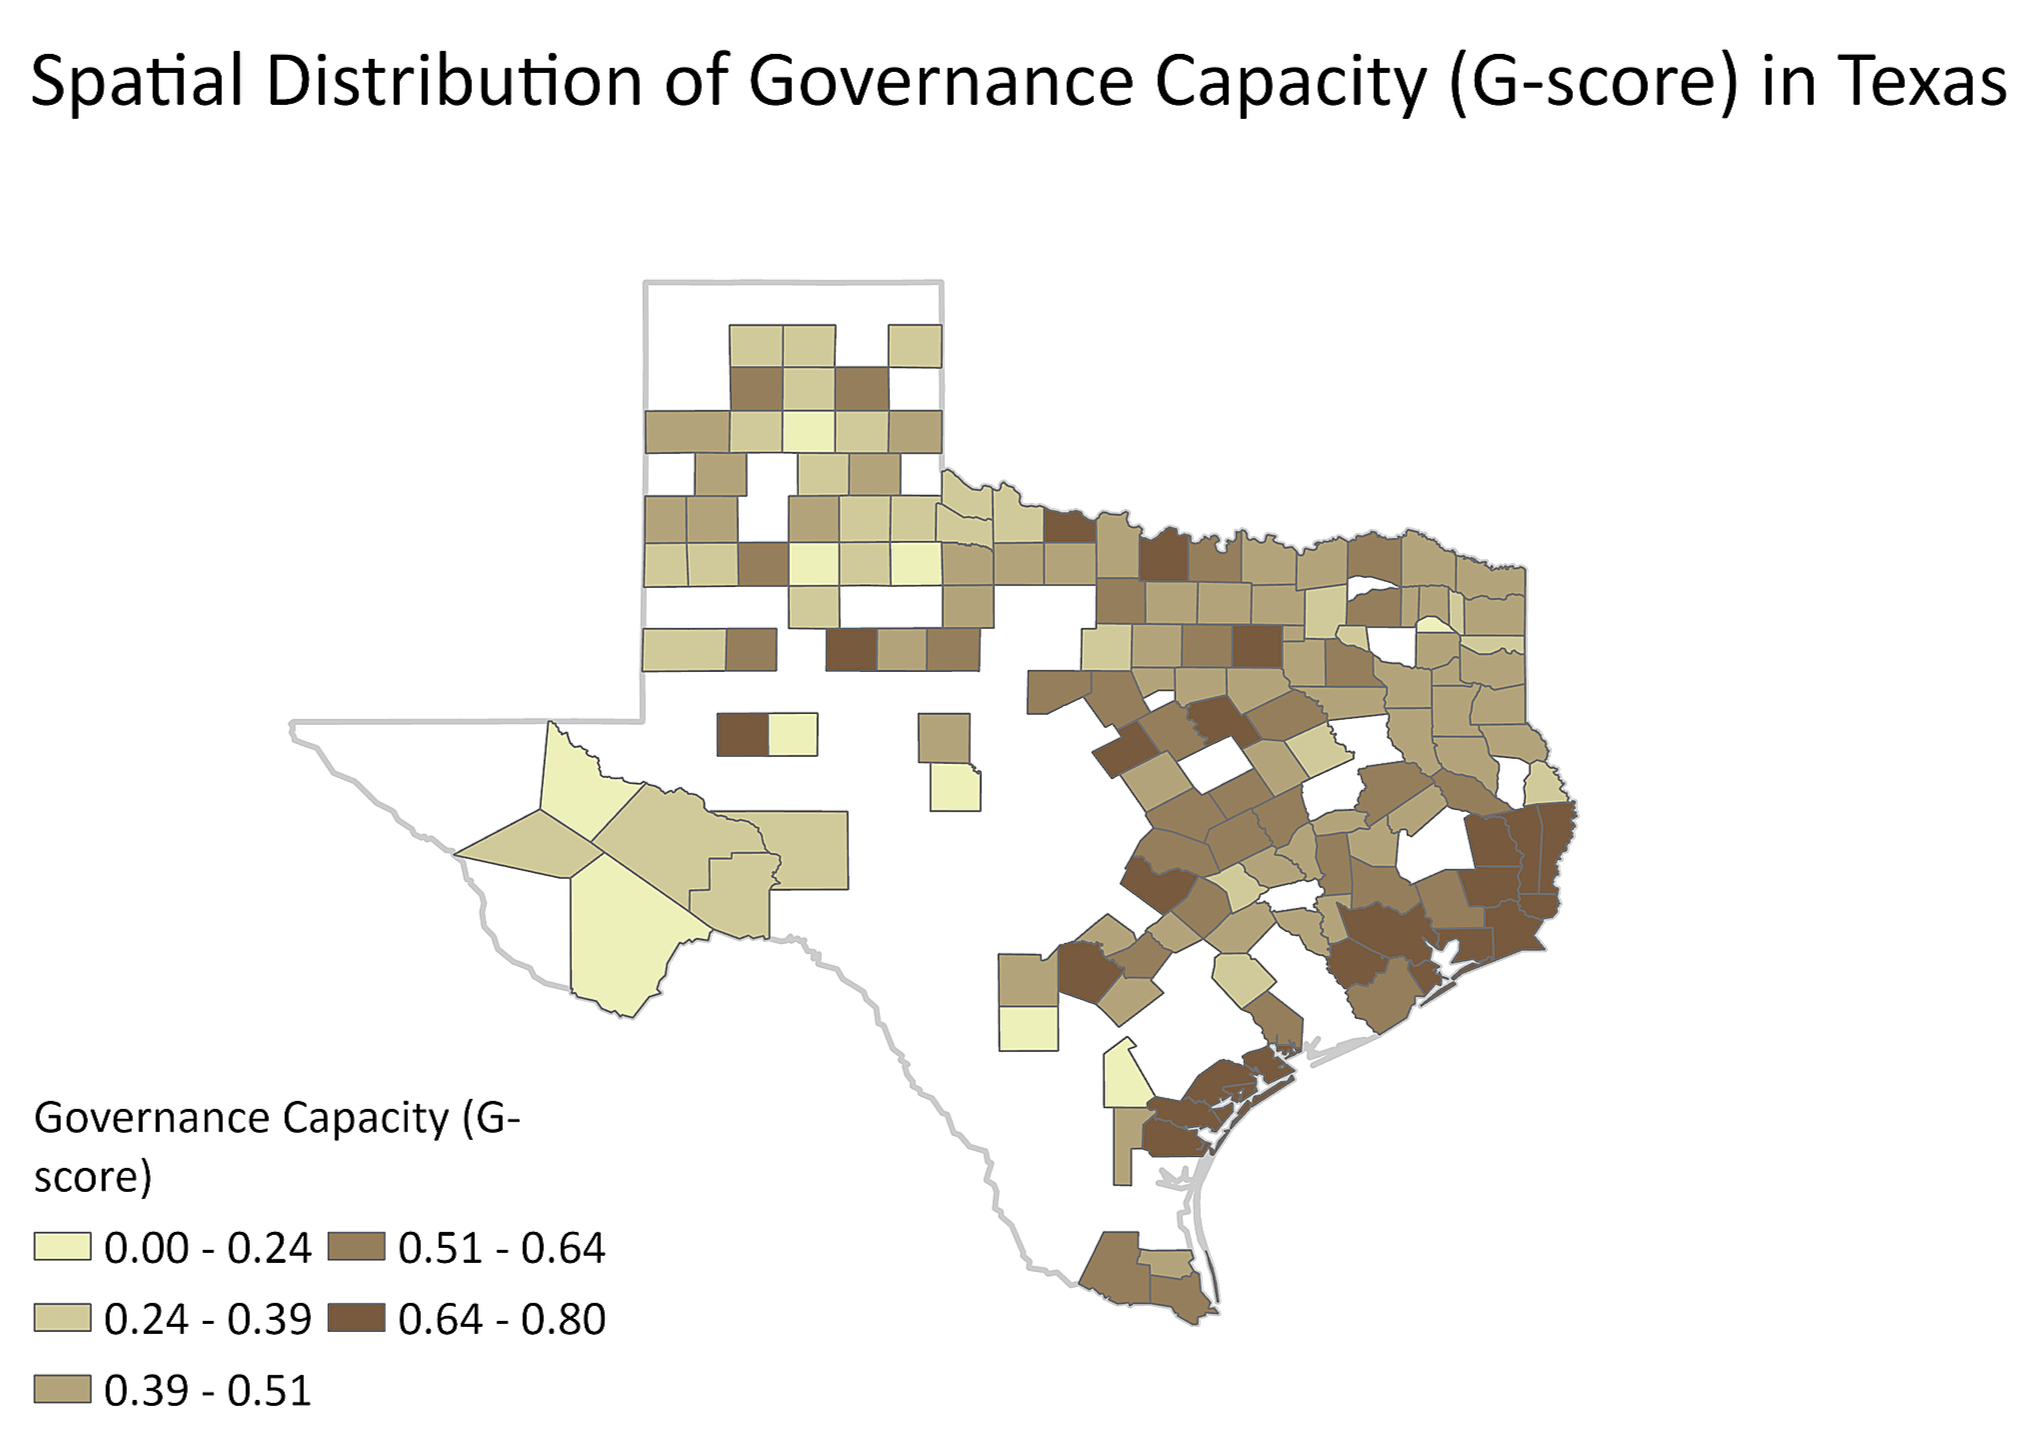
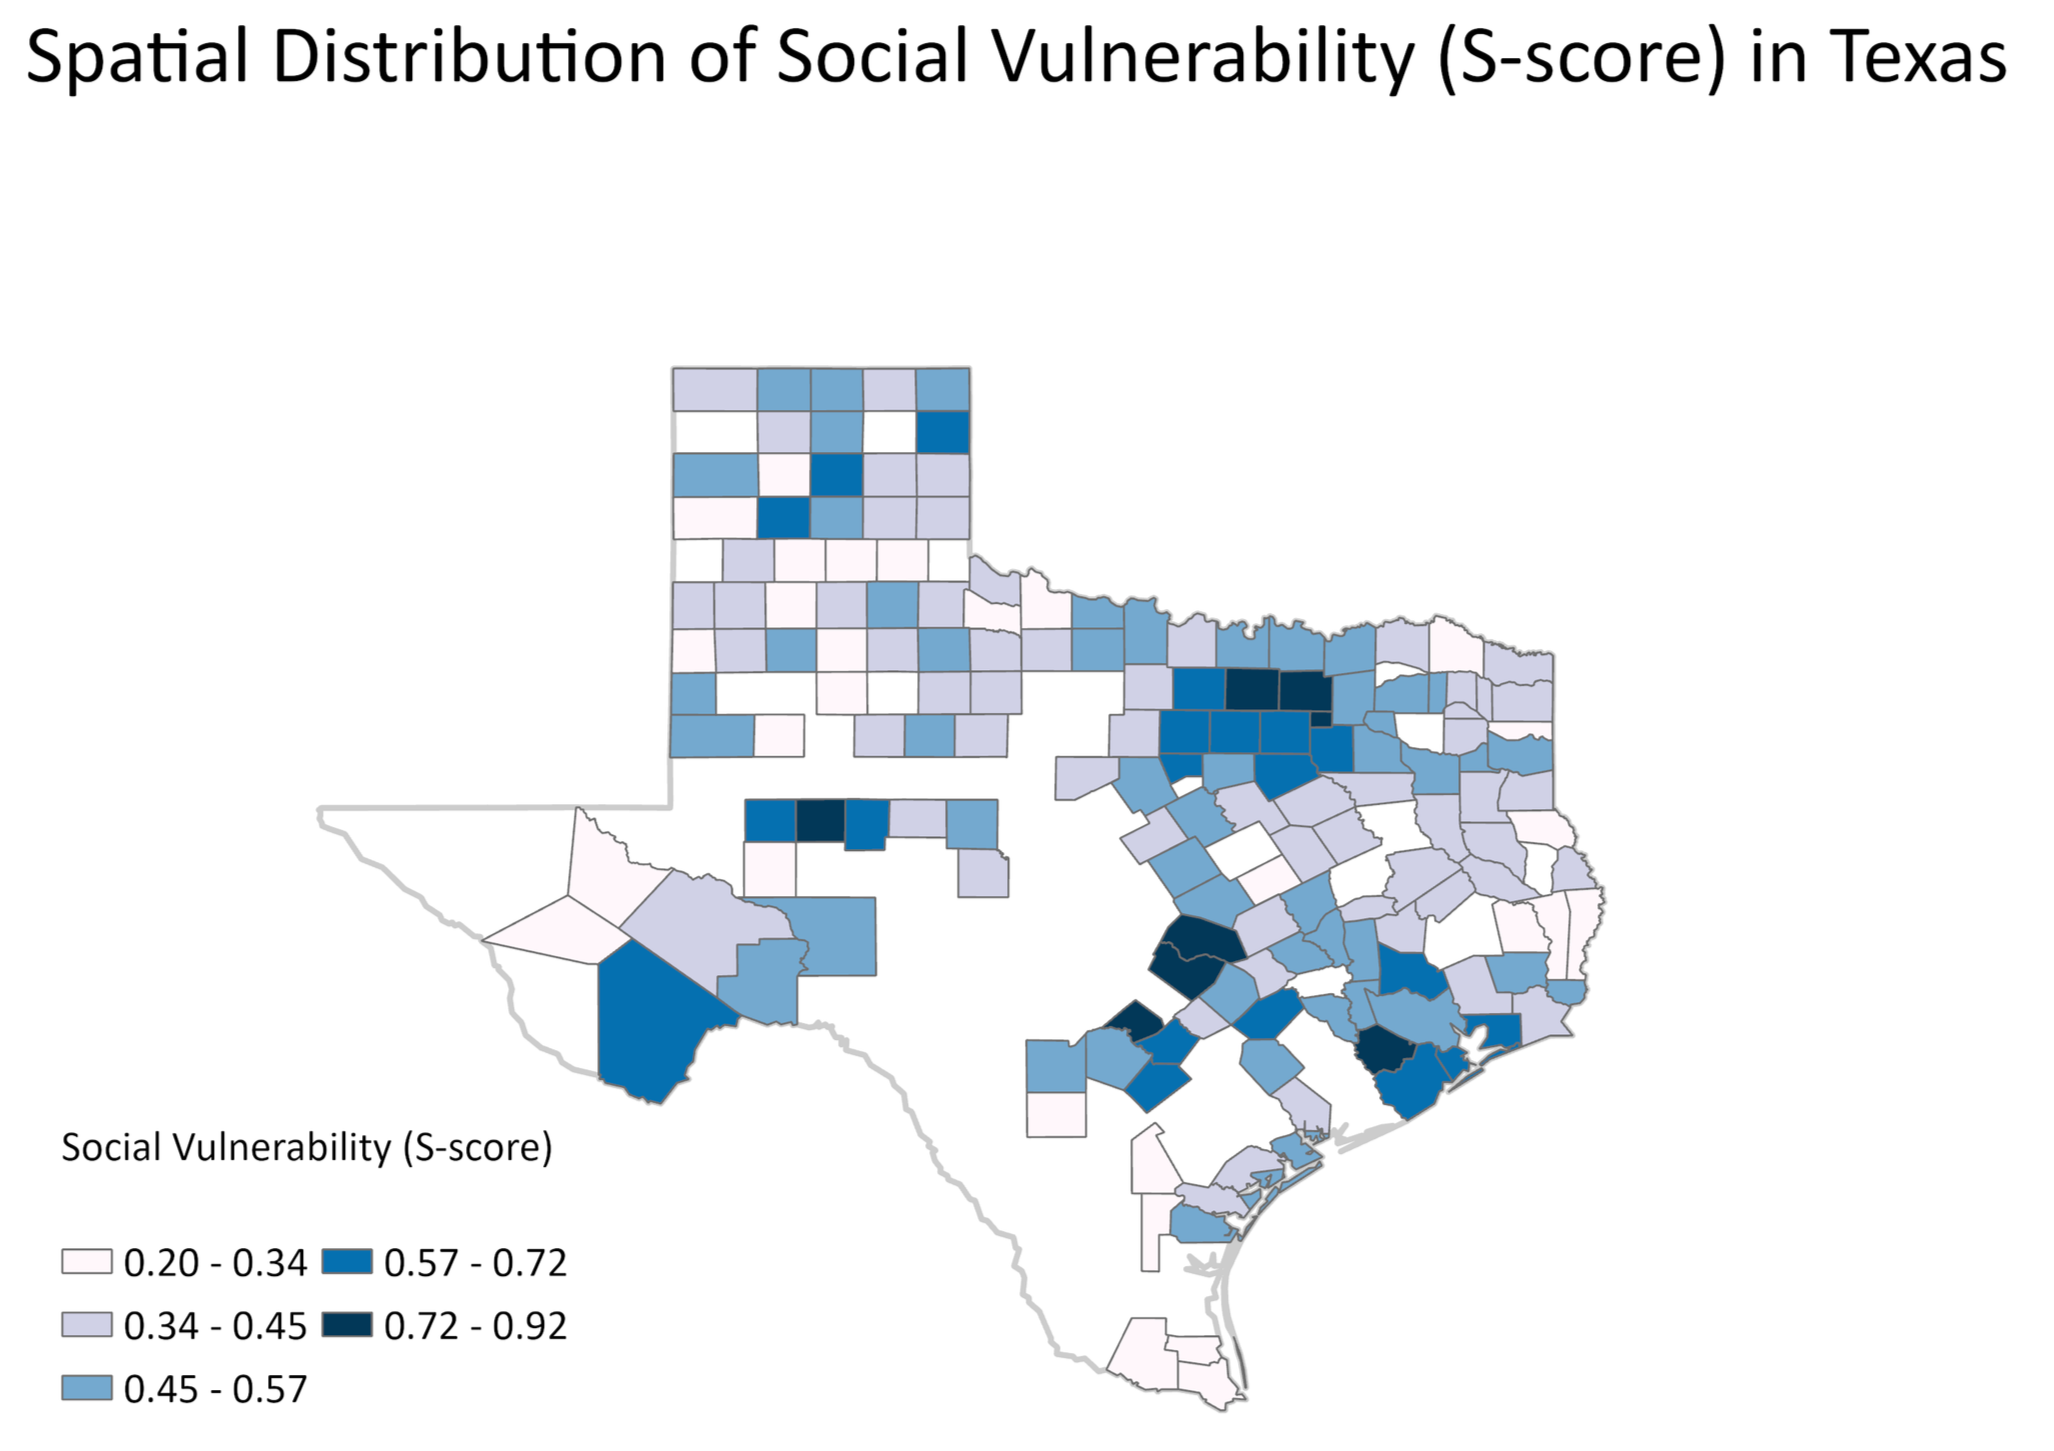
The spatial analysis reveals strong regional heterogeneity in tornado-related ESG risk across Texas. High ESG risk emerges where elevated environmental exposure and social vulnerability overlap, particularly in counties with relatively weaker governance capacity. In contrast, stronger governance in eastern and southeastern Texas appears to buffer composite risk despite comparable hazard levels.
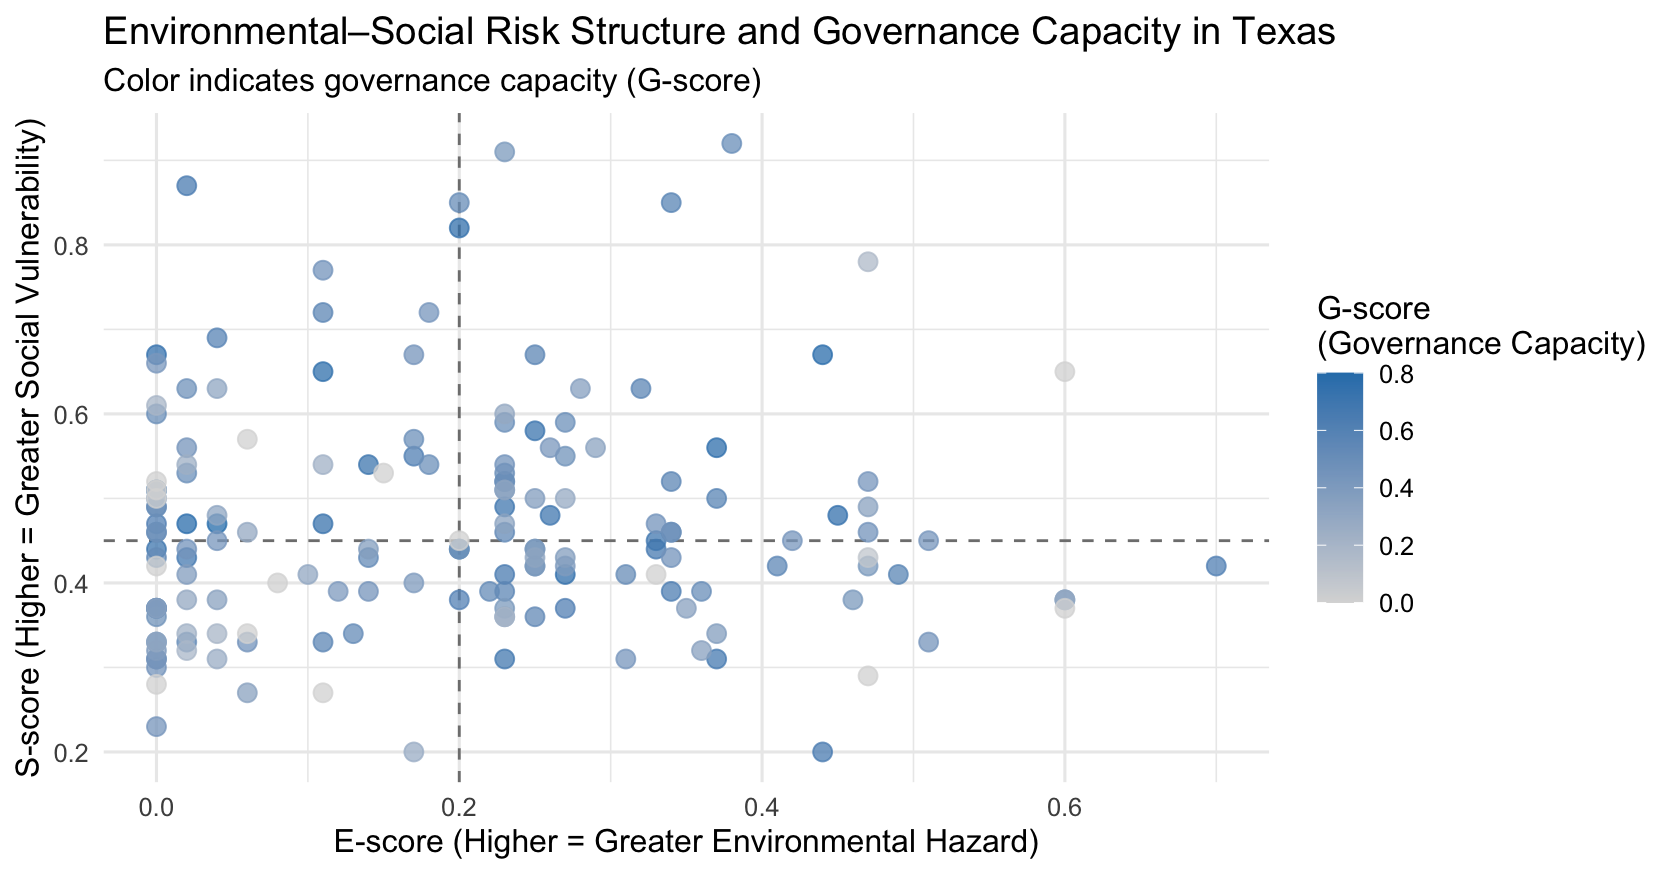
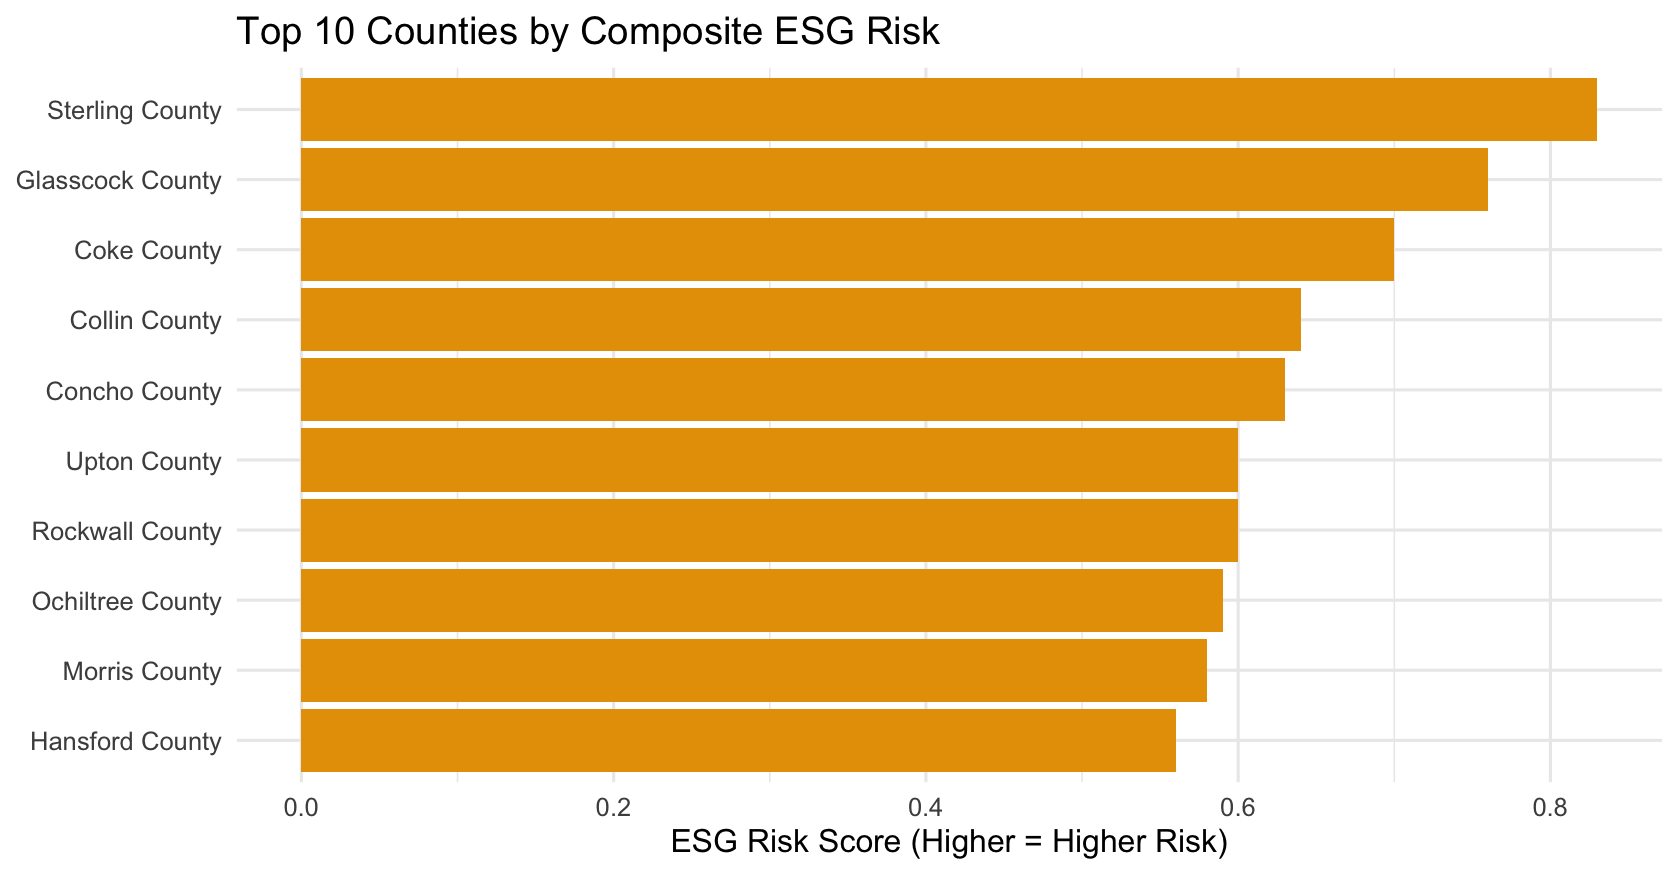
The Environmental–Social risk structure highlights a subset of Texas counties facing compounded ESG risk driven by simultaneously high environmental exposure and social vulnerability. Governance capacity varies substantially within this group, suggesting that elevated ESG risk is frequently reinforced by limited institutional capacity rather than environmental hazard alone. The Top 10 high-risk counties further demonstrate that ESG risk concentration reflects structural interaction effects across dimensions rather than geographic proximity or county size.
Key Insights & Implications
Hazard-only assessments are insufficient for identifying high ESG risk counties.
Counties with similar tornado exposure exhibit substantially different composite risk outcomes when social vulnerability is considered.Social vulnerability is essential for risk prioritization under comparable exposure levels.
Incorporating S-score enables clearer differentiation of high-risk counties that would otherwise be overlooked.Governance capacity functions as a moderating factor rather than a standalone safeguard.
Stronger governance reduces composite risk but does not fully offset the combined effects of high exposure and vulnerability.Effective risk targeting should be structure-based rather than location-based.
The dispersion of top-risk counties suggests that interventions should prioritize ESG risk structure over geographic proximity.